
Everyone knows it: the Windows Task Manager, which shows the user the load and resource usage of the computer and its running processes. The Task Manager is an integral part of the Microsoft Windows operating system. Often used as a process manager, it allows for the forced termination of hanging or locking programs. Modifications to the programs that load when Windows starts are also possible here. Resource conservation is essential for an efficient computer.
 Opening the Task Manager: There are many ways (tested on Win10/11)
1. On your keyboard, press Ctrl+Shift+Esc at the same time
2. Right-click on a free space in the taskbar and select the Task Manager from the context menu
3. Press the Windows Start button with your mouse (or keyboard) and type "task manager" into the search field. Before you finish typing, the Task Manager program will appear for selection.
Display utilization and resource consumption:
🔷 Performance
Within the Task Manager, select the "Performance" option. This will provide a clear graphical display of your computer's load and resource usage.
- CPU: Displays the current processor utilization in a graph. It also shows the total number of running processes, threads, and handles, as well as the average processing time, uptime, cache size, base speed, and the number of processors.
- Memory: The display shows you the available memory, used memory, free memory, and swap values. It also illustrates the form factor, occupied board space, and reserved resources.
- Disc: Capacity, designation, type, and current write and read speed are presented graphically here.
- Ethernet: Here you can find out how busy your network is, as well as the current sending and receiving speed of your wired connection.
- WLAN (if available): Current transmission and reception speed of your wireless network as well as connection type and identifiers.
- GPU: The data of your graphics adapter, its utilization and used or free graphics memory.
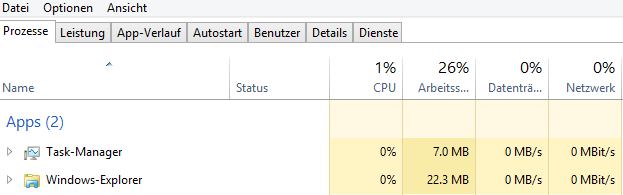
🔷 Active processes
Here you can monitor all active processes, their individual processor and memory usage, and network activity. Is a program hanging? Left-click on it, then right-click immediately, and select End Task from the context menu to force the program process to close. You can also manually limit the resource usage of individual processes in the context menu.
Little hint: The column display can be expanded with a left-click to show the program identity number (PID), current power consumption, graphics card usage, process name, execution location and much more. The result is more information about memory and execution location.
The additional columns "Command Line" and "Publisher" have proven useful for problem analysis. Not all processes bear the name of the parent program, and thus, it's not always logical to assign them. The list also includes processes that simply have the title "Programm" or "Program", which is not helpful when it comes to determining which program it is.
🔷 Autostart of Apps
The aforementioned "unknown" program titles also play a role in this section. Here, too, the display columns can be expanded to reveal the origin and execution location of the app with autostart privileges. Expand the bar here as well by right-clicking on the "Name" column label, for example, and adding "Command Line" and "Publisher" to the display.
By left-clicking on a displayed app name, you can disable automatic startup at system boot by selecting the corresponding option from the context menu. The same applies if you want to search for information about a program name on the Internet; in this case, simply select the "Search online" option from the context menu.
🔷 User
This section shows all processes running under a logged-in user account. By default, they are sorted by processor, memory, and disk usage, as well as network usage.
🔷 Details
This section is for detailed information. Here, all processes are displayed under their respective user names, along with their active memory usage in kilobytes, process architecture, and description.
Here, too, you can sort them by clicking on the column label. For example, the Task Manager sorts the view alphabetically by clicking on the "Name" column label, and in ascending and descending order by clicking repeatedly. Of course, you have the same convenience for the other columns as well.
🔷 Services
The Services section describes all known program processes, including their program identification number (PID), description, and current status. Here you can find out whether the process is active or terminated and to which process group it belongs.
~~~
🚩 All in all, the Windows Task Manager can be described as an effective tool for initial problem analysis with "hanging" or "stalling" programs. Is a program consuming too much memory or CPU power? These and other questions can be answered here. The Task Manager consistently provides performance data and allows you to force-quit disruptive applications.
The autostart of programs can also be quickly monitored and modified here.